
There’s a simple rule underlying antler development in whitetail bucks that all hunters should understand. Awareness of this rule provides a bridge over many of the false expectations, myths, mistakes and frustrations that lie waiting along your path to QDM success.
The rule is this: If you could know all the gross antler scores for every buck a local population could potentially produce, the scores for each age class will form a bell-shaped curve when plotted on a graph. I know this sounds an awful lot like geometry or algebra, but bear with me. It’s easier than it sounds, and it’s worth your time. The antler-growth bell curve has significant implications for your QDM efforts.
What’s a Bell Curve?
The peak of a bell-shaped curve represents the average of the data plotted on the graph, and the slopes on either side of the peak are the “outliers,” the individuals that deviate from the average, either below or above.
For example, most humans have average intelligence (the peak of the bell curve), while geniuses (the far right slope of the bell curve) and those with very low intelligence (far left) are rare. You have to push through hordes of 6-foot-tall adult men before you find any 4-footers or 8-footers – again a bell-curve distribution. The same bell-curve distribution applies to buck antler scores by age class. For example, let’s say most of the 5 1/2-year-olds a population could produce will score in the 130-class. That’s our average, and thus the 130-class represents the peak of the bell curve. Somewhat fewer 5 1/2-year-olds will score in the 120s, even fewer will score in the 110s, and so on (thus the frequency line is sloping downward on the left side of the “bell”), and rarely this population might produce a 5 1/2-year-old that will only gross in the 90s! Deviations from the average in the other direction go like this: Fewer bucks will score in the 140s than will in the 130s; even fewer in the 150s, and so on. Rarely, this population might produce a 5 1/2-year-old that grosses in the 170s.
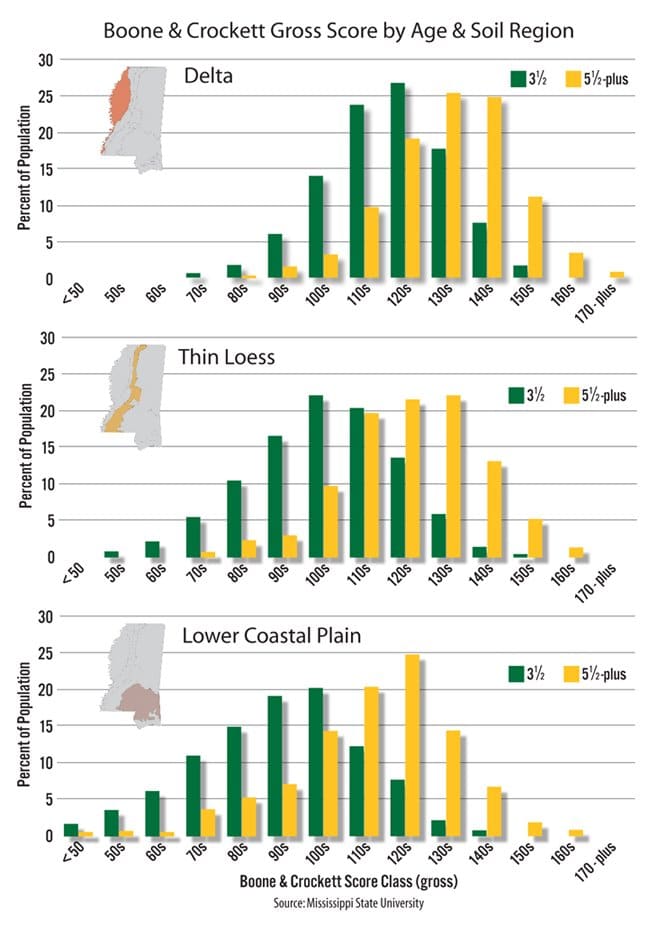
Antler growth bell curves can shift to the right in regions with higher soil quality. Mississippi’s Lower Coastal Plain contains the lowest quality habitat, while the Delta region features the highest quality habitat.
From region to region, the span of the bell curve will change positions along the X-axis. Regions with better habitat and better soils will have a higher maximum range and a higher minimum range. Pick any random location in Wisconsin, for example, and the extreme upper end of the bell curve for 5 1/2-year-olds is probably somewhere over 200 inches gross. Do the same thing on a coastal barrier island in my home state of Georgia and the extreme upper end may not break 100. But no matter where you put your finger on the map, you find a bell-shaped curve in every buck age class. If you chart each age class on the same piece of paper, you find the bell curves overlap significantly. You may find bucks of three, four or more age groups with the same gross score. Rare high-scoring young bucks match average-scoring middle-aged bucks and rare low-scoring mature bucks.
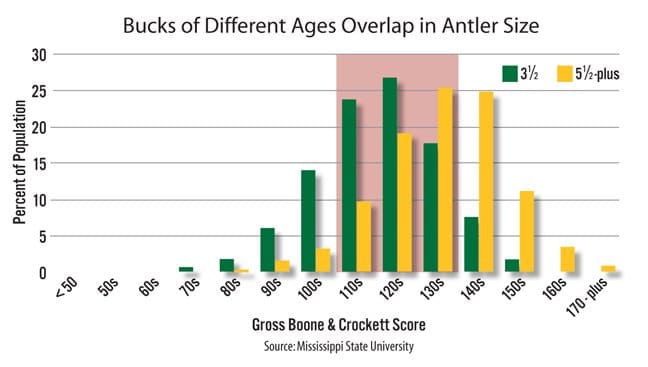
A great amount of overlap exists between higher-quality, middle-aged bucks and lower-quality, mature bucks in these data from a high-quality soil region of Mississippi.
One of the best examples of this I ever saw was in South Texas. I was lucky to get to participate in a day of deer research, Texas-style. Tagging along with researchers from Texas A&M-Kingsville, I watched helicopters fire rocket nets to capture more than 75 antlered bucks in one day. Each deer was tagged, measured, poked, prodded and released. This was in the so-called Golden Triangle, the famous land of el Muy Grande, so you might think I got to see a lot of gargantuan bucks. Actually, not even one. Out of dozens of mature bucks captured and handled that day, the best I saw might have approached 150 inches gross, and he far out-scored the rest. A pile of mature bucks in the 110s and 120s were seen that day. That’s the bell-curve in action. Most mature bucks, even in famous areas like South Texas, are in that peak in the middle of the bell curve. So how is South Texas so well known for los Muy Grandes? Statistics! Crank out sheer numbers of bucks in older age classes and you increase the occurrence of those rare top-performers. This requires vast acreages under private control with very light hunting pressure, especially on bucks, until they are fully mature, and South Texas has these conditions. Back east, those rare top-performers that might break into the 170s and 180s at 6 1/2 years of age are often shot long before that.
For a visual of this, see the graphs above. You can see real data from three different soil-quality regions of Mississippi, expressed in some very eye-opening illustrations first published in Quality Whitetails by Drs. Steve Demarais and Bronson Strickland of Mississippi State University.
Sound research has shown we can’t make measurable changes in genetics in free-roaming whitetails through selective harvest. In other words, you can’t change the bell curve’s shape. However, in a QDM program, you can shift the entire bell curve to the right (increasing antler-score potential in each age class) by improving habitat, sex ratios, herd health and other factors. The highest-scoring and lowest-scoring bucks in each age class will still be rare compared to those with average scores, but their actual score potential will be higher.
Here are just a few of the important lessons we can learn from the antler-growth bell curve:
Inferior Deer Are Extinct
Let’s get past this idea of “inferior” deer. There’s nothing wrong with bucks in the far left slope of the bell curve for their age, any more than there’s something right with bucks at the other extreme. That these models are part of the bell curve at all indicates they are all models that work under existing survival pressures – the inferior models are extinct. If a whitetail with 400 inches of antler was a viable model in the wild, it would have a place in the bell curve. But whitetails of this size exist only where they are created and cared for by deer breeders. Outside the fence where survival must be earned, a 400-inch whitetail is the inferior deer.
Select Bucks for Harvest Based on Age
If you ultimately want to increase the numbers of mature bucks in the high-scoring end of the bell curve, you must avoid shooting them when they are immature. The problem is, these uncommon bucks have large antlers at an earlier age, often meeting antler-based harvest rules such as spread and point restrictions before they are middle-aged.
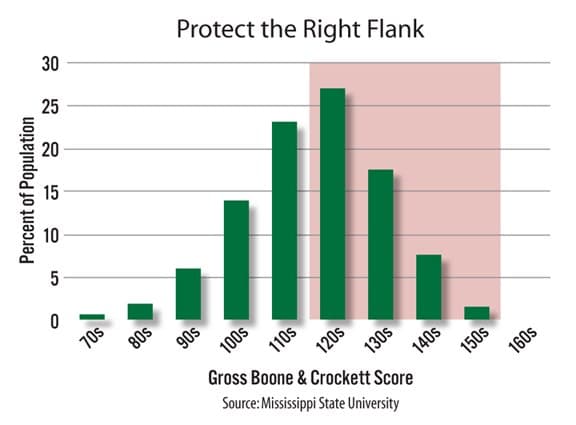
In the oldest buck age group you want to protect, emphasize protection of the bucks in the right half of the bell curve (bucks that are more likely to be mistaken for older deer due to their above-average antler size). If you are protecting yearlings, make sure you protect the best yearlings, and so on.
Judging age is not as easy as judging antler spread or number of points, but it can be done. It’s a matter of getting to know the physical characteristics of your local deer, practicing your skills in the field and with trail-camera photos, and then checking your estimates (using jawbone or cementum annuli aging) to refine your skills whenever a buck is harvested. Yes, accuracy requires practice, but the alternative is to continue removing high-scoring bucks before they’ve had a chance to show you their bell-curve potential.
Measure Achievement Using Age
Age means something, so measure your achievements by age. Regardless of antler size, a mature buck is a significant achievement for any hunter. To make it to maturity, a buck has to run a gauntlet of death in many forms. Those that are easy for hunters to see and kill seldom make it through. Those that are hard to see and kill fall victim to other things like hemmorhagic disease, infections of the skull and brain caused by fighting injuries, automobiles, rut exertion followed by winter stress, and more. What’s left are the truly uncommon survivors, and their numbers decline every year. Charted by age class, these numbers present a different kind of shape on a graph: a steep slope declining to a vanishing point. Kill a buck whose age is near the very bottom of the slope, just before the line crashes into the X-axis, and you have killed the rarest of bucks in the population. When you are starting out managing deer, a 3 1/2-year-old may be a rare veteran that represents a great achievement. After success building age structure, reaching 5 1/2 might be a remarkable milestone for a buck where you hunt.
I look forward to the day when no shoulder mount of a buck displays the full accomplishment without the jawbone, or a cementum annuli lab report, mounted nearby for all to see.